

Packaged foods company J.M Smucker (NYSE:SJM) met Wall Streets revenue expectations in Q3 CY2025, with sales up 2.6% year on year to $2.33 billion. Its non-GAAP profit of $2.10 per share was in line with analysts’ consensus estimates.
Is now the time to buy J. M. Smucker? Find out by accessing our full research report, it’s free for active Edge members.
J. M. Smucker (SJM) Q3 CY2025 Highlights:
- Revenue: $2.33 billion vs analyst estimates of $2.32 billion (2.6% year-on-year growth, in line)
- Adjusted EPS: $2.10 vs analyst estimates of $2.10 (in line)
- Management reiterated its full-year Adjusted EPS guidance of $9 at the midpoint
- Operating Margin: 18%, up from 7.5% in the same quarter last year
- Free Cash Flow Margin: 12%, down from 14% in the same quarter last year
- Sales Volumes rose 6% year on year (2% in the same quarter last year)
- Market Capitalization: $11.12 billion
"We are pleased with our second quarter results and the positive momentum that we are experiencing in our business," said Mark Smucker, Chief Executive Officer and Chair of the Board.
Company Overview
Best known for its fruit jams and spreads, J.M Smucker (NYSE:SJM) is a packaged foods company whose products span from peanut butter and coffee to pet food.
Revenue Growth
A company’s long-term performance is an indicator of its overall quality. Any business can have short-term success, but a top-tier one grows for years.
With $8.77 billion in revenue over the past 12 months, J. M. Smucker is one of the larger consumer staples companies and benefits from a well-known brand that influences purchasing decisions. However, its scale is a double-edged sword because there are only a finite number of major retail partners, placing a ceiling on its growth. For J. M. Smucker to boost its sales, it likely needs to adjust its prices, launch new offerings, or lean into foreign markets.
As you can see below, J. M. Smucker grew its sales at a sluggish 2.4% compounded annual growth rate over the last three years, but to its credit, consumers bought more of its products.
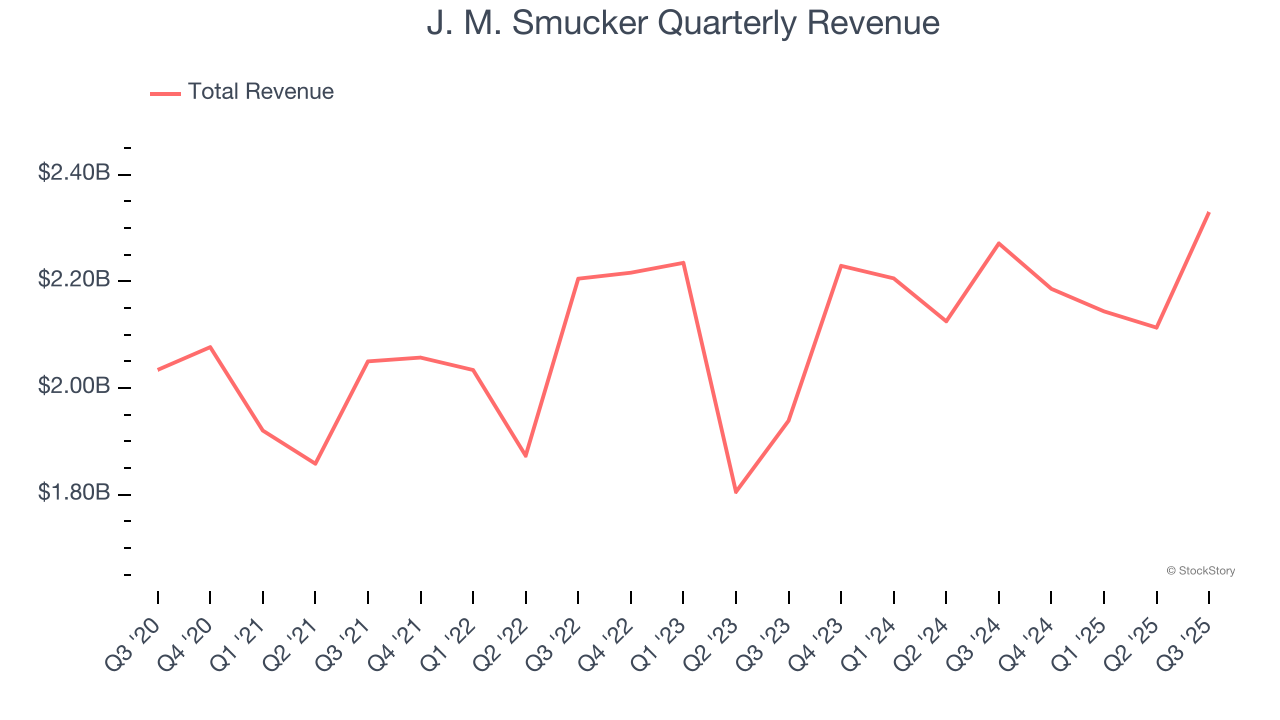
This quarter, J. M. Smucker grew its revenue by 2.6% year on year, and its $2.33 billion of revenue was in line with Wall Street’s estimates.
Looking ahead, sell-side analysts expect revenue to grow 5.3% over the next 12 months, an acceleration versus the last three years. This projection is above the sector average and suggests its newer products will catalyze better top-line performance.
While Wall Street chases Nvidia at all-time highs, an under-the-radar semiconductor supplier is dominating a critical AI component these giants can’t build without. Click here to access our free report one of our favorites growth stories.
Volume Growth
Revenue growth can be broken down into changes in price and volume (the number of units sold). While both are important, volume is the lifeblood of a successful staples business as there’s a ceiling to what consumers will pay for everyday goods; they can always trade down to non-branded products if the branded versions are too expensive.
J. M. Smucker’s quarterly sales volumes have, on average, stayed about the same over the last two years. This stability is normal because the quantity demanded for consumer staples products typically doesn’t see much volatility. 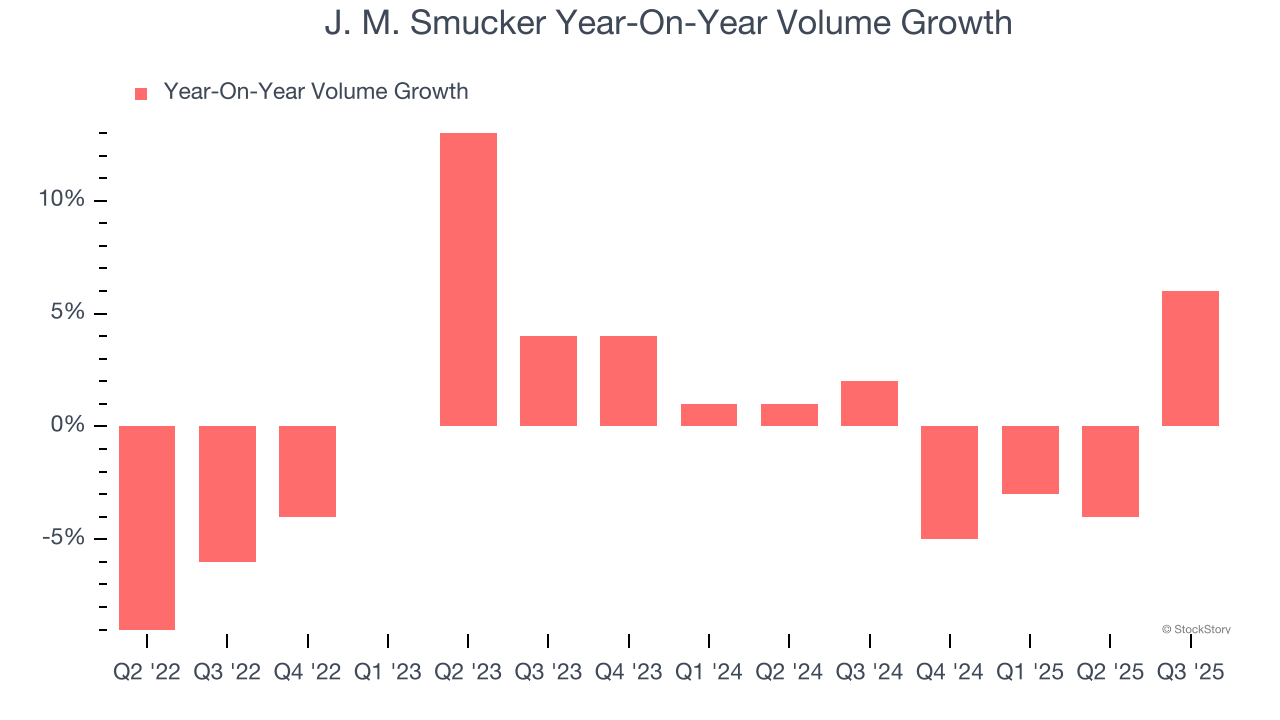
In J. M. Smucker’s Q3 2026, sales volumes jumped 6% year on year. This result was an acceleration from its historical levels, certainly a positive signal.
Key Takeaways from J. M. Smucker’s Q3 Results
Revenue and EPS were both in line, and management reiterated full-year EPS guidance. This quarter was without many surprises, good or bad. The stock remained flat at $104.39 immediately following the results.
Sure, J. M. Smucker had a solid quarter, but if we look at the bigger picture, is this stock a buy? If you’re making that decision, you should consider the bigger picture of valuation, business qualities, as well as the latest earnings. We cover that in our actionable full research report which you can read here, it’s free for active Edge members.